| Greg's source code navigation tools |
|
||||||
|
|
|
|
|||||||||||
This page is a log of an investigation I made of source code navigation and analysis packages in June and July 2005. It will necessarily remain incomplete, but I may update it.
I started the investigation because I was in the position of needing to cut a large program into two halves and insert a clean API between them. To do this I need to get a good understanding of how the control flow works, and I was looking for tools that might help me. Here are the tools I've seen so far, along with references in some cases to people who pointed me at them.
I have at least looked at these packages; there are more below that I have not investigated.
My usual tool is etags, but that doesn't really help show call graphs etags will follow the control flow downwards with the find-tag command (M-. in Emacs). It's useful at times, but a little pedestrian for what I want to do.
Date: Thu, 30 Jun 2005 11:30:26 -0700
From: Darryl Okahata
cscope will show me all callers for a function. This is closer, but it's still not overly easy to read.
There's also the XEmacs interface to cscope, at sourceforge. I'm not sure how useful it is for you, but it's what I use for browsing (disclaimer: then again, I wrote that interface).
Jeffrey Hsu introduced me to Source Navigator in August 2004. It gives a graphical representation of the downwards control tree for a function. It doesn't seem to be able to go in the other direction, i.e show what functions call a specific function. The FreeBSD port also currently installs in a place you wouldn't expect, and the documentation doesn't match: you need to run the program /usr/local/sourcenav/bin/snavigator I have a bug report against this problem.
Date: Thu, 30 Jun 2005 06:40:25 -0700
From: Evan Dower
doxygen documentation as well. That does fine in a downward direction, but in my case I'm trying to fit an API under the package, so I really need to see what is calling me, and doxygen doesn't do that. Arguably the graphic representation is nicer.
As I understand it, doxygen can be configured to produce both call graphs and called-by graphs.
I have spent enough time looking at kscope to dedicate an entire page to it. kscope is a KDE wrapper for cscope. KDE programs scare me, with reason: just installing it pulled in 86 (really!) other packages, including Samba and OpenLDAP.
Once I started it, it produced no useful output, and though I haven't given up, the interface turns me off: popups with windows too small to enter text in. It's reminiscent of k3b, with which I had so many problems in June 2005. After installing it, I couldn't get it to do anything useful, but the following day I managed to import some files (you have to specify the names as a subset wild card: * doesn't do anything). It can indeed display an upside-down calling function tree:

|
|
||||||||
Once again I have this terrible layout; the window is far too small, the text too big, the fields are truncated, I can't find a way to change the default size of the window, and there are not even normal resizing buttons. I've already told it to use smaller fonts, which it does in some places, but not here.
This is the window thrown up after you manually enter the name of the function (bp_wrap_file_write) and click on all the + boxes up to the top level call (in this case, process_connection). But I'm left wondering if it's worth the trouble:
In fact, the window contains (rather than displays) more information: it's hidden behind the scroll bars:

|
|
||||||||
You still can't do anything with it; the corresponding cscope output is more useful, since despite its unfriendly interface, it at least allows you at the sources.
I've never liked eye candy and GUIs for the sake of it, but in this case a GUI would be a good idea. It's sad that it has failed so badly.
Shortly after writing the above, Elad Lahav, the author of kscope, sent me a message complaining that the criticism was unjust. Well, at least he made it clear to me that I could (should) have contacted him. I'll do so in such cases in future.
He sent a number of suggestions, which I left until I had time to explore them completely. I finally started again on 18 August 2005. In case some of the problems might be related to FreeBSD, I tried it on SuSE Linux 9.3 this time.
After installation, which went without problems, I started the program, and it asked me for the locations of cscope and ctags:
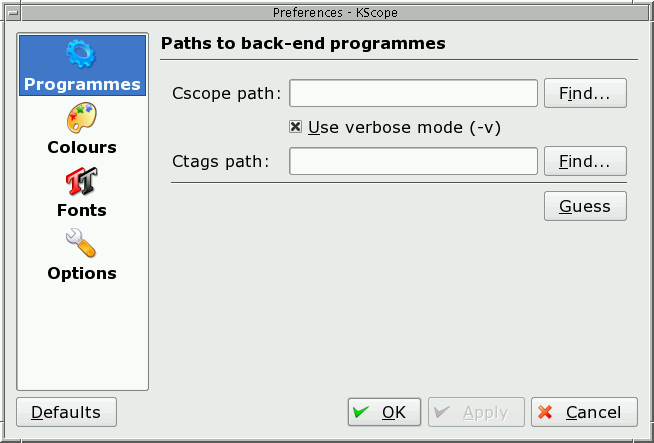
I don't know why: they were in the execution path. I selected Find and it started looking for them in the current directory.
Then I discovered the Guess button, but by then it was too late. It wouldn't take a guess, and after restarting it didn't present the dialogue, though I had canceled any change. To actually find the programs, I had to use the which utility:
=== root@deeveear
(/dev/pts/0) /src/BLFS/trunk.trunk/blockpool 48
-> which cscope ctags /usr/bin/cscope /usr/bin/ctags
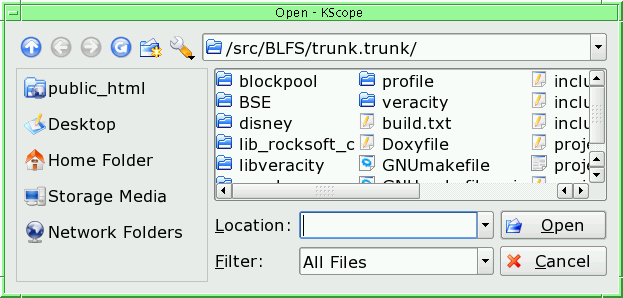
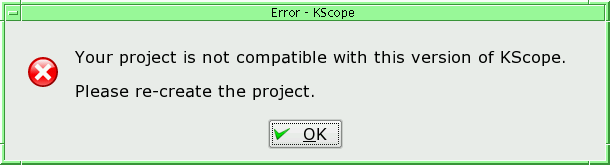
The next step was to create a project. This was even more of a problem than last time. On the first attempt time it told me that the directory already existed, without specifying which directory. From the help file, it turns out that it tries to create a subdirectory with the name of the project, and this clashed with one of the existing subdirectories. I chose a different name and got:
Reading the help file shows that it wants a full path name; another example of the lack of UNIX-sensitivity. There's also no default for the path name, so when you start in the correct directory you still need to type in its (possibly long) directory name. When I did so, this message went away, so it seems that this error message is another way of saying “You didn't enter an absolute path name”.
After that, added the source files to the project and got a transient message saying that a process couldn't be started; but then it claimed:
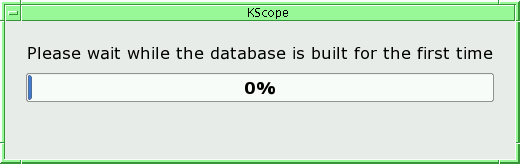
It stayed like that for a long time, over 10 minutes, with no evidence of any progress. I killed the process and restarted. It didn't know the process. I had to manually search for it with the directory tree tool, after which I got the same messages as before.
I gave up with Linux and went back to FreeBSD, where things went beyond this stage; building the project file was practically instantaneous.
Date: Sun, 03 Jul 2005 11:06:23 +0400
From: Diomidis Spinellis
You could also try CScout. The latest version supports call graphs, including calls to / from / through function-like macros.
Diomidis didn't mention that he's the author. I've tried this. In FreeBSD there's a port, though strangely only for the “stable” version. I created one for the development version. Given that it was developed on FreeBSD, the port was trivial.
CScout looks good. A nit with the documentation: it recommends using the file example/awk.c in the distribution as an example, but it's not there.
Date: Wed, 29 Jun 2005 23:34:52 -0700
From: Bakul Shah
A program suite called `global' was once part of freebsd which I liked quite a bit. It even created web pages where you can click on function calls to take you to their defn and so on. I believe there was a cross-ref as well (callers of a function). But it has been a while....
Date: Thu, 30 Jun 2005 10:30:00 -0300
From: Gustavo De Nardin
I like Global: /usr/ports/devel/global, http://www.gnu.org/software/global/
a quick usage guide:
cd src
gtags
htags
lynx ./HTML
I discover that I have investigated global on a previous occasion. At the time I wrote:
[global] looks something like etags on steroids. It installed nicely and works pretty much like etags. I'll need to work out which of the additional functionality it provides is really of use; converting source files into hyperlinked web pages doesn't seem very useful to me, for example. One thing it doesn't do is to provide any easy way to get to the function declaration.
Date: Thu, 30 Jun 2005 10:36:53 +0400
From: Denis Antrushin
Did you tried cbrowser? It's a tcl/tk GUI around csope, and if I recall correctly, it can show you code surrounding call. http://cbrowser.sourceforge.net or in ports/devel
cbrowser is another program without documentation. The only thing available is a README file, which gets installed as /usr/local/share/cbrowser/README. Most gives license and installation information; the only user documentation is:
   The whole point of cbrowser is that it simplifies usage of source code
   querying tools, therefore it is designed to be self-explanatory.  There is
   some basic online help available to supplement anything that isn't
   intuitively obvious.
Starting the program shows that there is in fact online “help”. The window is empty, and the help says:
To perform a query, first enter the text of the query in the query field. Optionally select the query type from the Query menu. This will determine the type of results the query will yield. For more information on the types of queries, see the cscope manpage. Once the query value has been entered, simply press <Enter> or click the Submit button to perform the query. While the query is in progress, the Query button becomes an Abort button allowing you to cancel long queries.
It would be nice to know what the term “query” means, and how to enter it, but it appears to be one of the queries you can issue to cscope. It displays the code pretty much the way cscope would, except that it sets a very difficult-to-read reverse video, which apparently can't be changed. It doesn't really do any better than cscop at showing calling dependencies (i.e. only a single level). This is another package where I wonder if it's even worth the trouble to find out how it works.
The following are suggestions that I have received and on which I need to follow up. When I do, I'll move them to their own section above. I'm quoting mail messages here.
Date: Wed, 29 Jun 2005 23:34:52 -0700
From: Bakul Shah
You may also like the old id-utils package too...
Date: Thu, 30 Jun 2005 16:10:31 +0800
From: Ying-Chieh Liao
maybe this helps ? http://www-128.ibm.com/developerworks/library/l-graphvis/
Date: Thu, 30 Jun 2005 17:56:48 +0900
From: gnn@FreeBSD.org
Go to www.codespelunking.com and look at tools. I recommend global over the old etags/ctags solution.
I recommend global+cscope+doxygen. Others also like cflow+dot for viewing call graphs.
Date: Thu, 30 Jun 2005 11:47:09 -0400
From: Craig Rodrigues
Have you looked at Understand for C++ from Scitools? http://www.scitools.com/ucpp.html (available for Windows, Linux, and a few other Unixes).
Based on your description, I think it does quite a bit what you want to do, including Call Trees.
Date: Thu, 30 Jun 2005 13:13:56 -0701
From: Jos Backus
Not free, but /usr/ports/devel/linux-understand_c should do what you want. It's a pretty nice code spelunking tool, too.
Date: Thu, 30 Jun 2005 11:03:16 +0200
From: Michel Talon
Have you tried ncc? I has worked fine for me. http://students.ceid.upatras.gr/~sxanth/ncc/
Date: Sat, 13 Apr 2013 04:55:20 -0700 (PDT)
From: Ruben
I'm suggesting that you try my tool and list it on your page. Here it is: https://github.com/ruben2020/codequery
| Greg's home page | Greg's diary | Greg's photos | Copyright |