
| Greg's network link statistics |
|
||||||
|
|
|
|
|||||||||||
This page shows my network availability and performance statistics connected to the Australian National Broadband Network. It bases on earlier pages that I wrote for the DSL and satellite connections.
I had hoped that with the advent of the NBN, this page would no longer be needed. Unfortunately, this has proven not to be the case. While I don't have issues with throughput, the availability has been the worst I have ever experienced, with outages of up to 48 hours. It's not clear where the problem lies, but I have observed serious issues with the DHCP authentication that my ISP uses. More here when I understand the situation better.
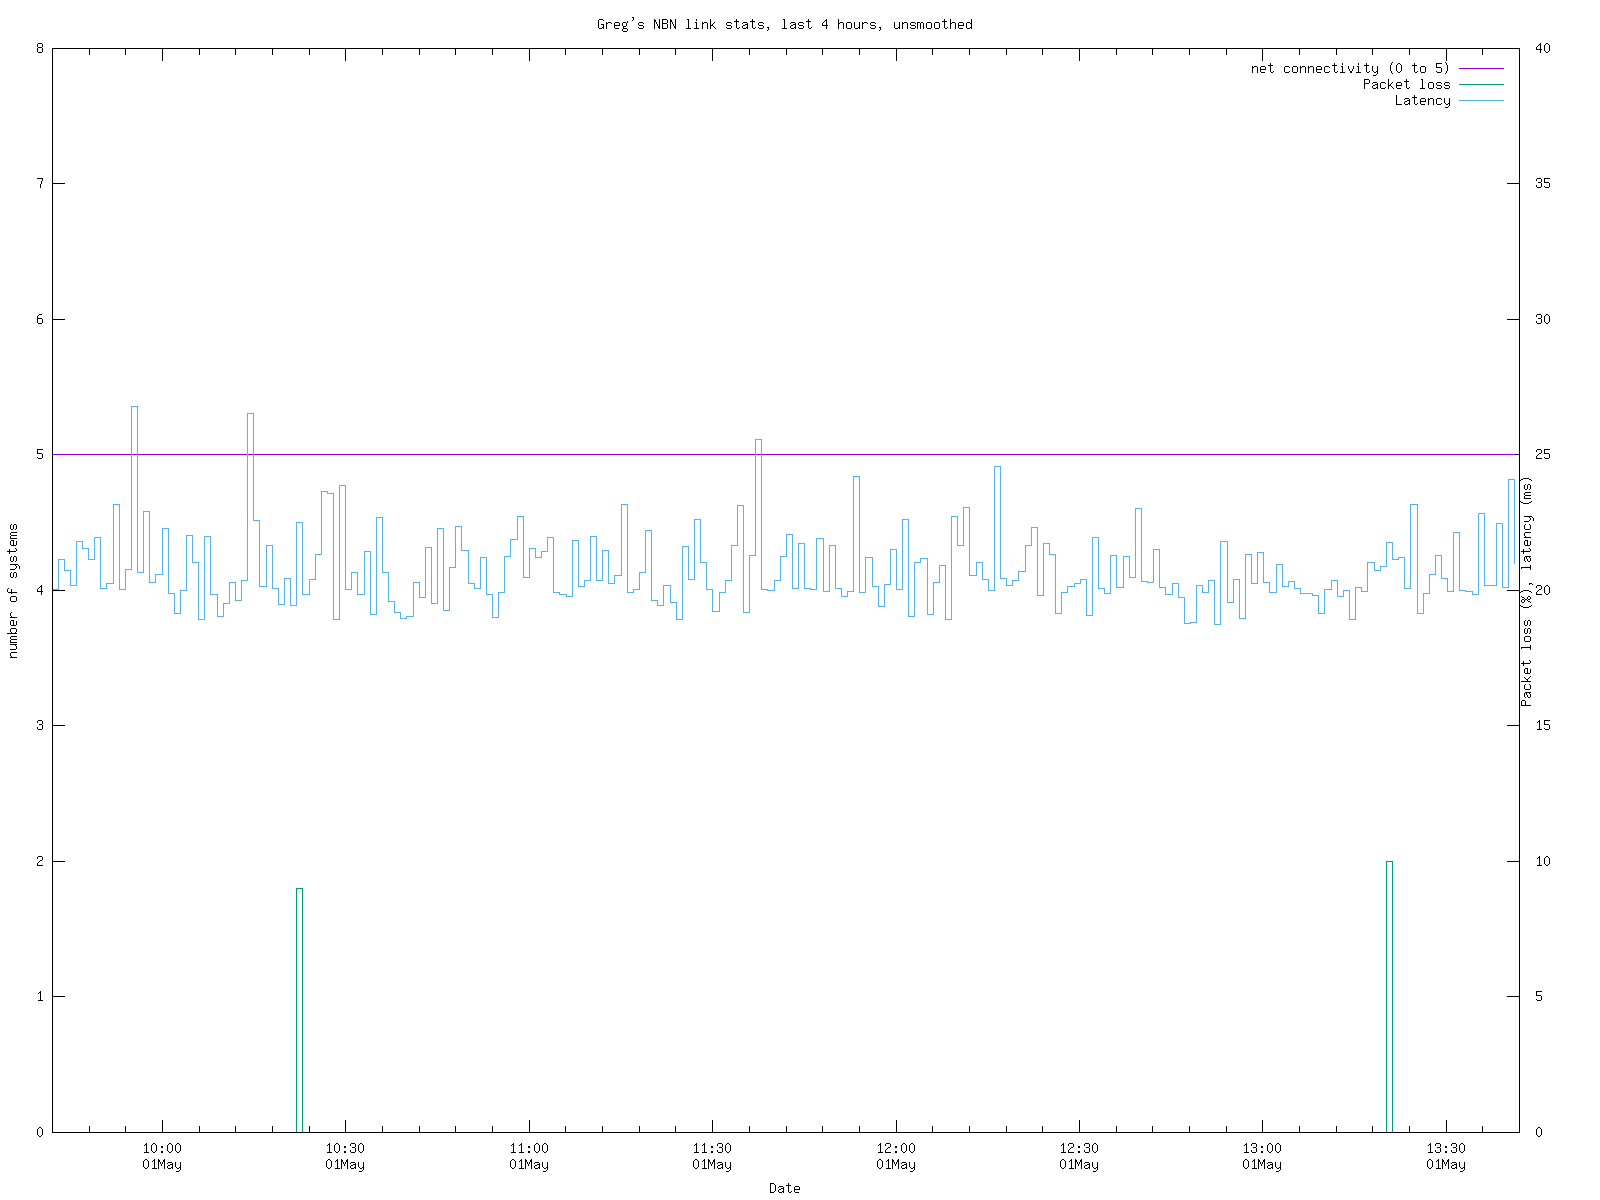
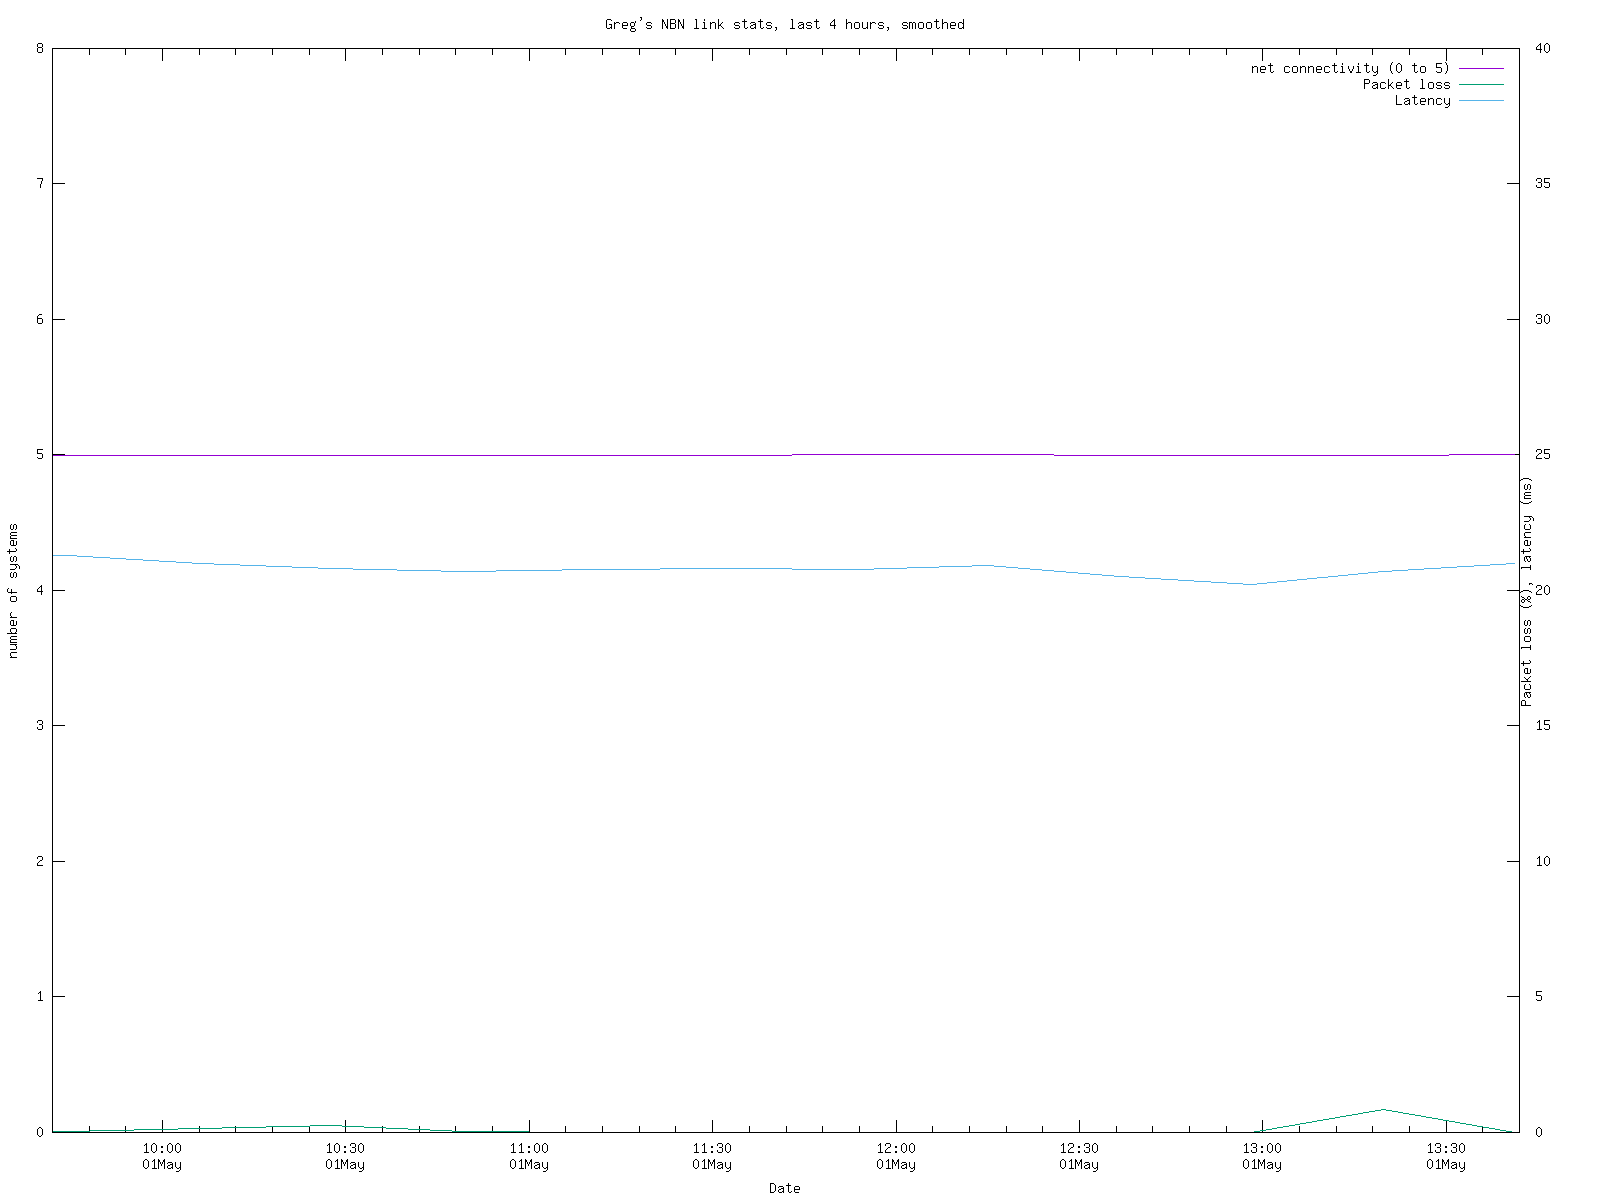
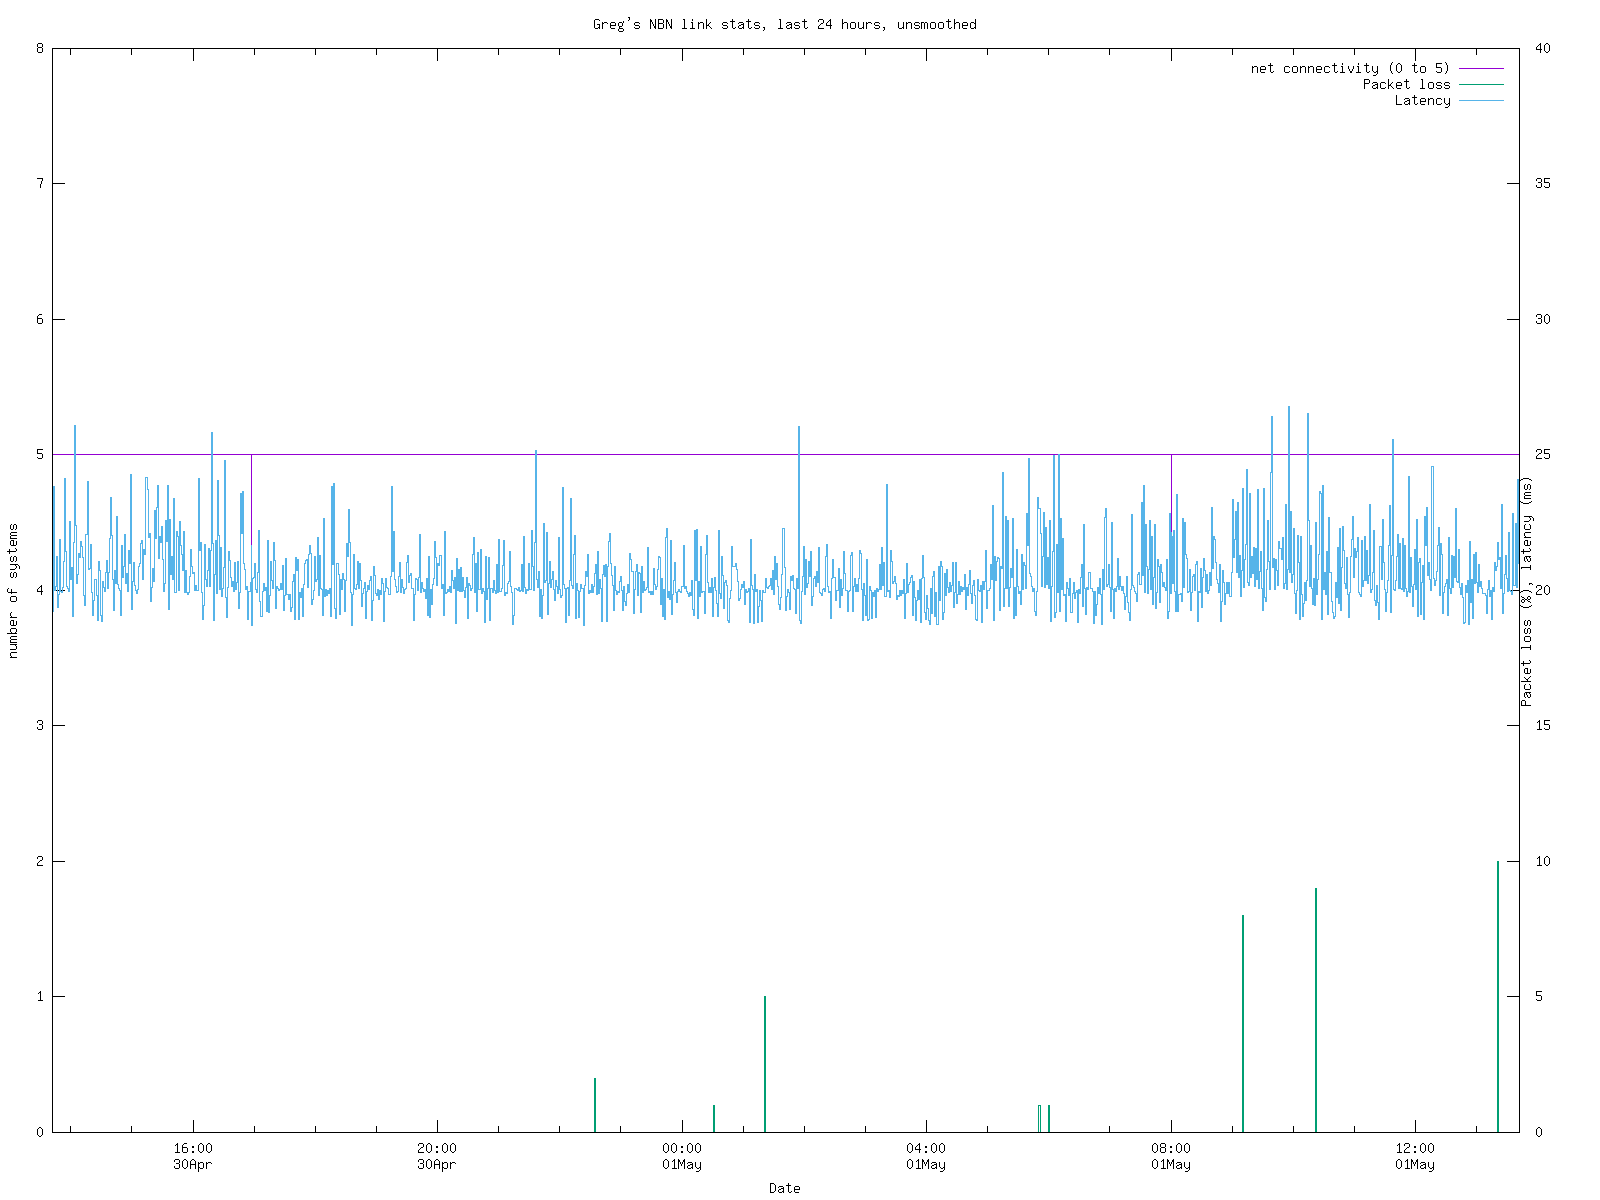
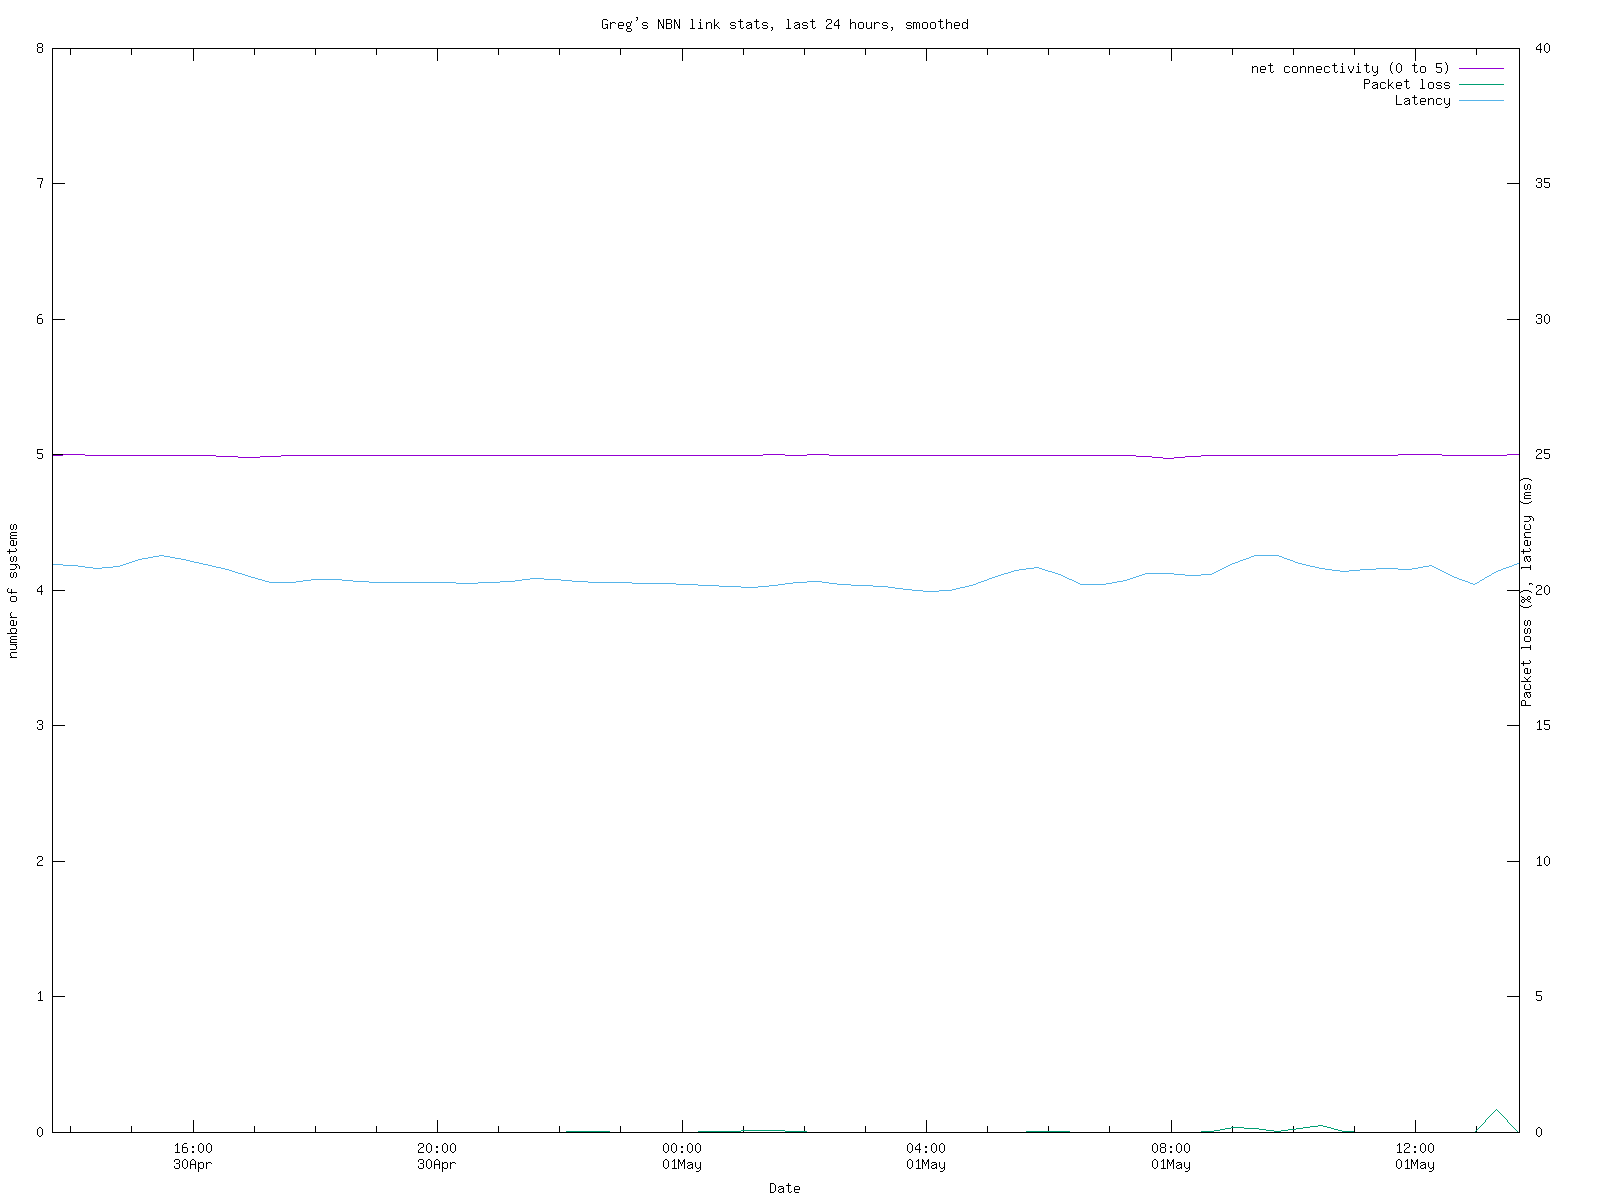
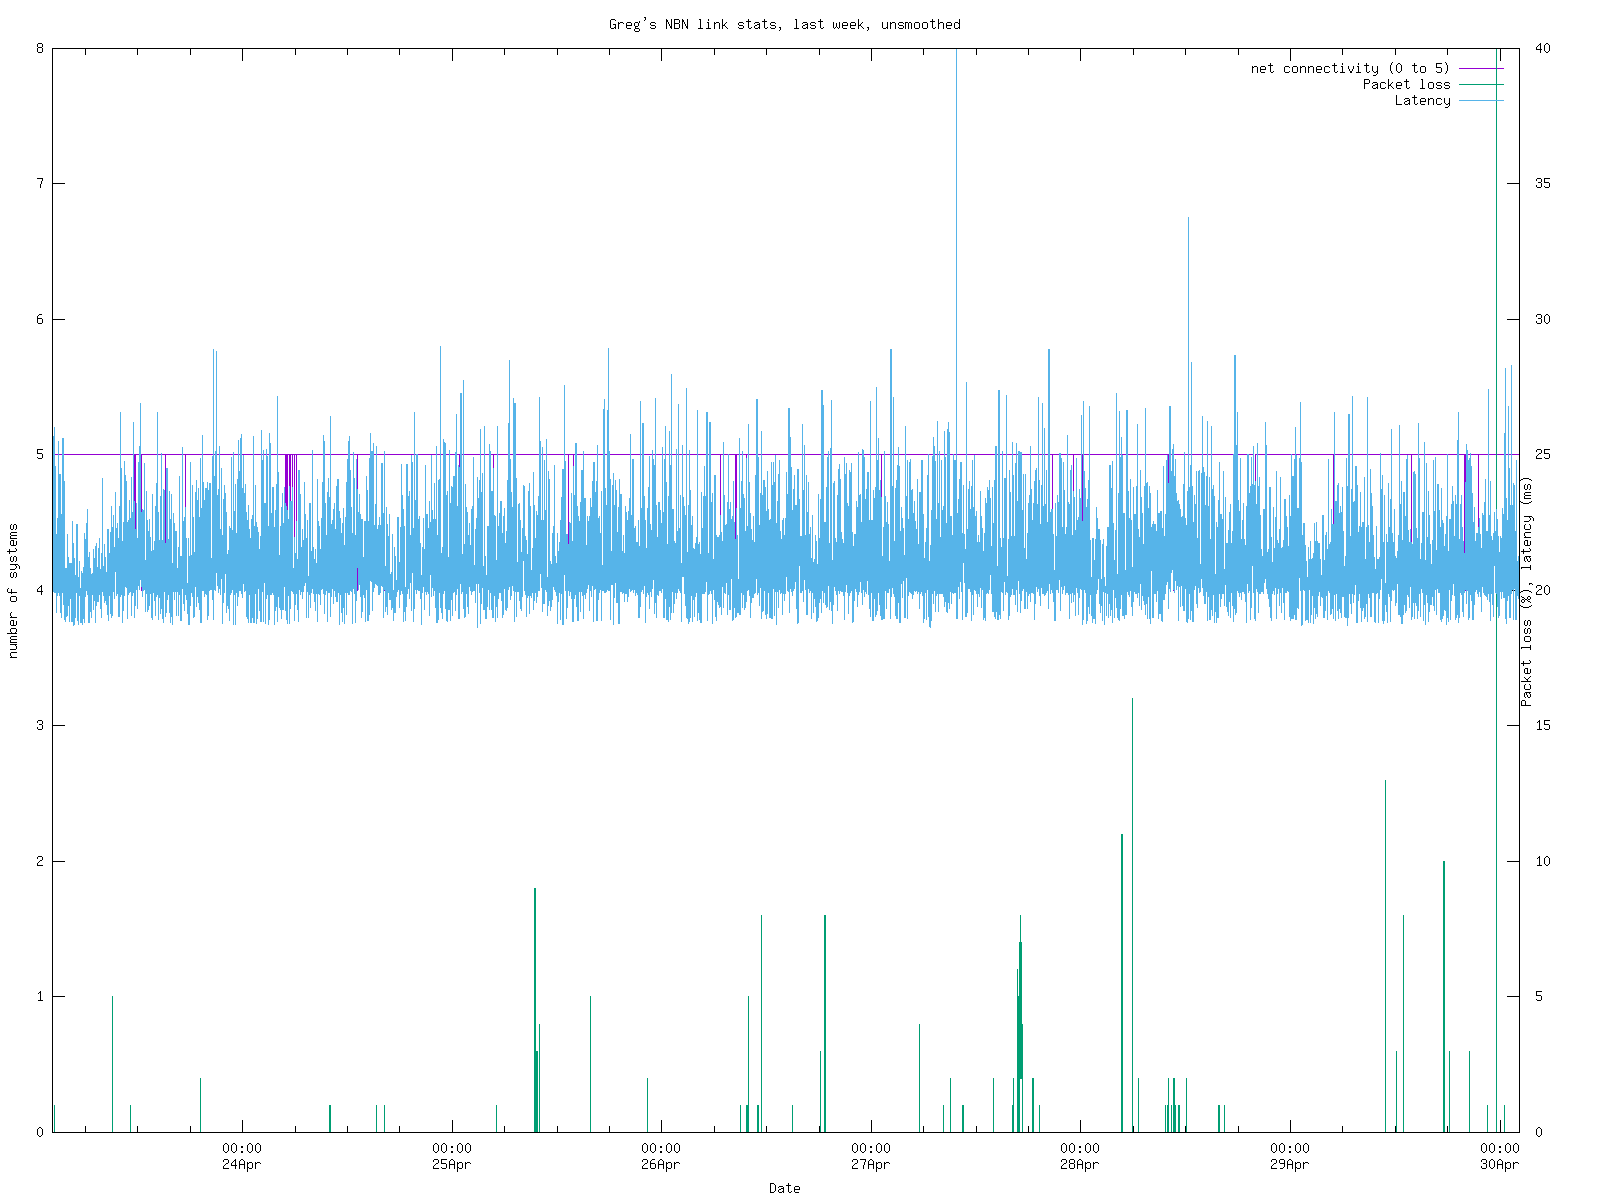
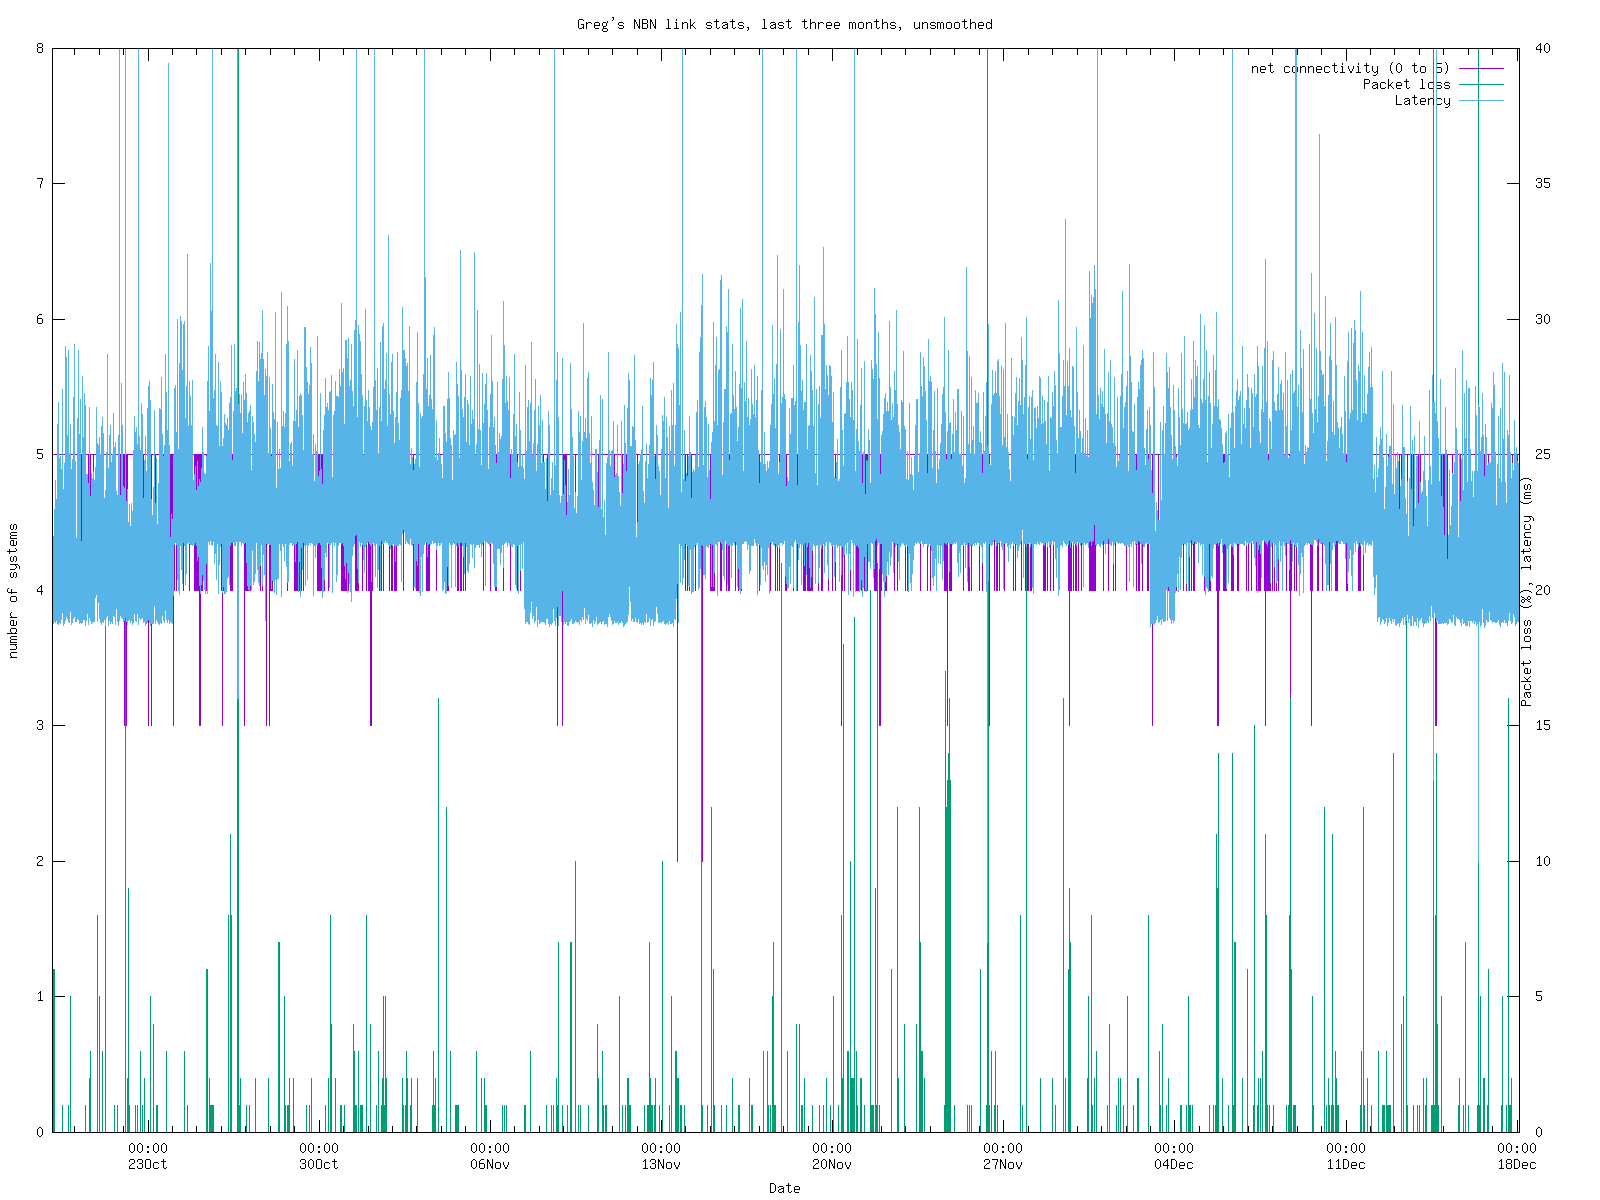
The graphs show:
Network status. This is the number of remote systems responding to a ICMP echo (ping) packet at the same time as the link status ping. I currently ping 5 systems which I frequently access: freefall.freebsd.org (now somewhere in New York state), www.lemis.com, my external web server in Raleigh NC, ffm.lemis.com, located in Frankfurt am Main, ozlabs.org, located in Canberra, and ftp.netbsd.org, located somewhere in the USA. Normally this value should be 5. If it's less, the script retries every second until full connectivity is restored.
Link packet loss, which has proven to be a significant issue since early 2018. I send 20 ICMP ping messages to the other end of the network link and count how many are lost.
I previously had parameters "link status" and "TCP speed”, but they no longer seem to make much sense.
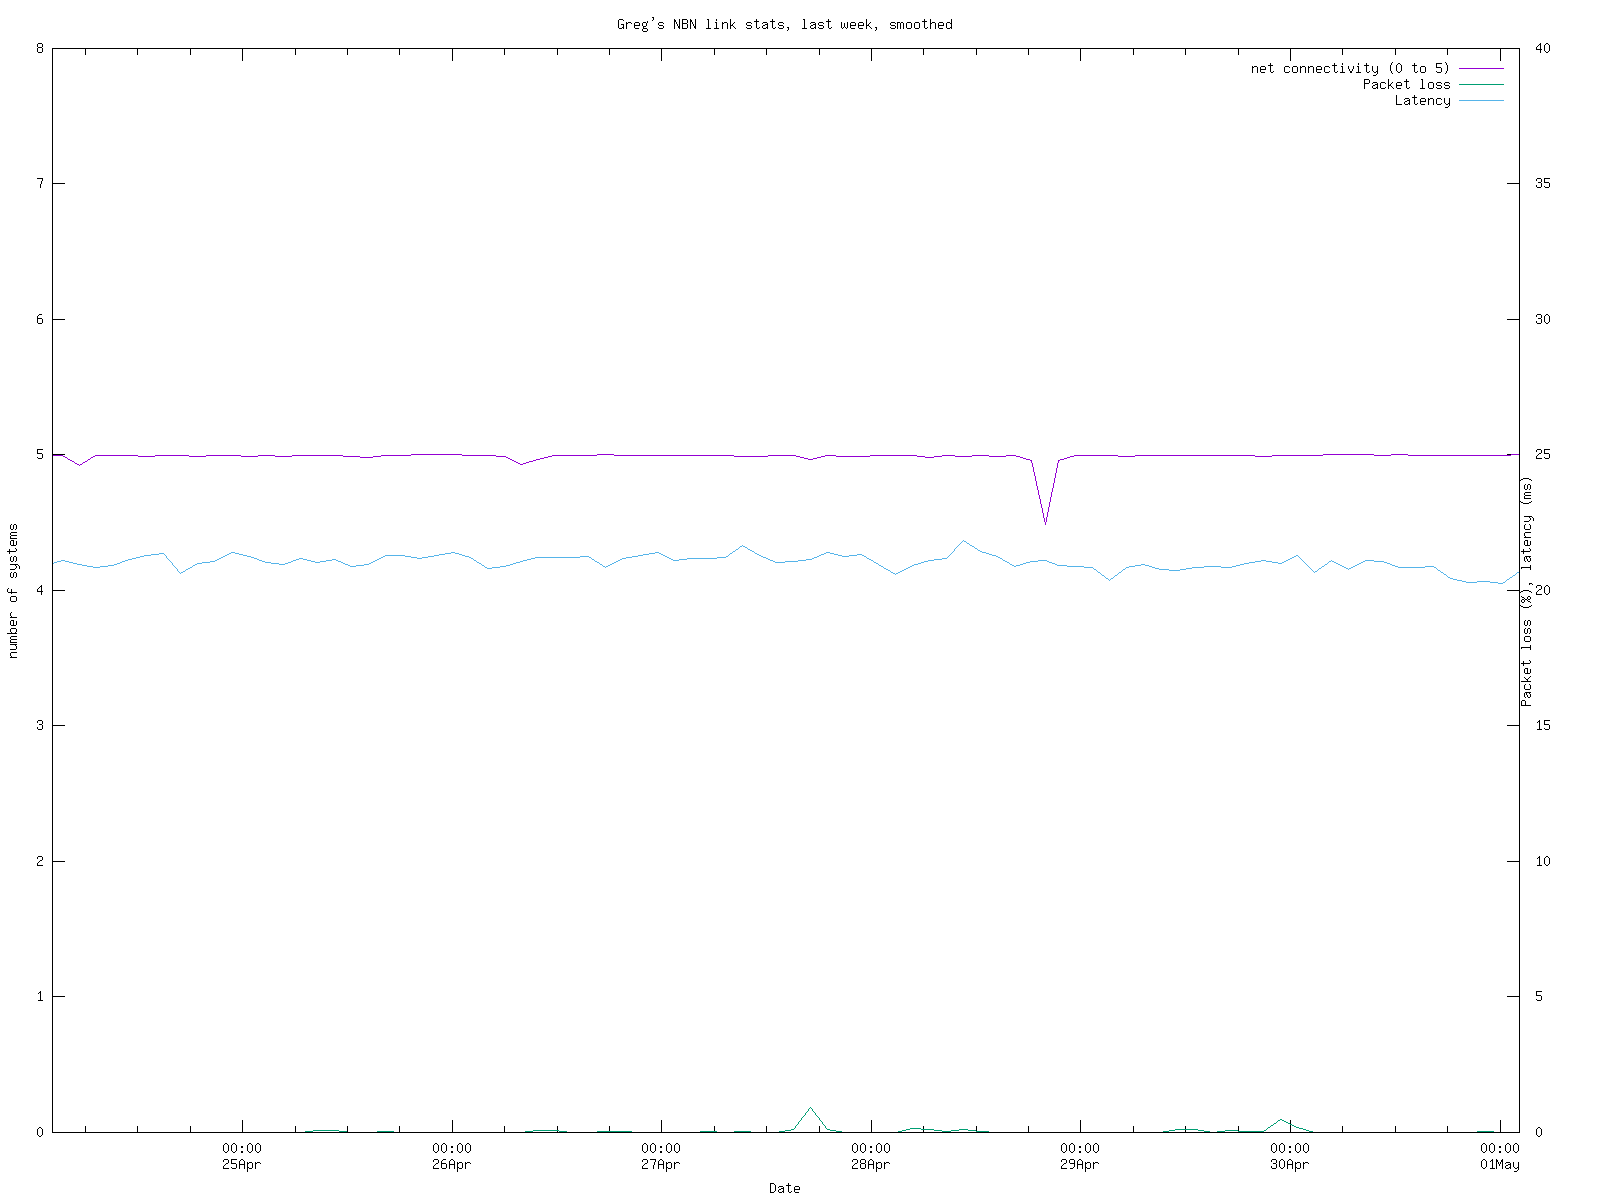
The graphs were made with gnuplot, and I'm not very happy with the smoothing. In particular, the right-hand side of smoothed graphs has too much influence, and it's easy to get the false impression that the link status or TCP speed have changed significantly in the last few minutes. If anybody can point me at a way to fix this problem, I'd be grateful.
Click on the graphs for a 1600x1200 version.

This section monitors the NBN link for outages, including planned outages. I have manually edited the data to remove false positives, such as when moving house. I have a program that evaluates the outage information and produces detailed outage information. Here's the information on the past 20 outages, along with the overall statistics:
Start time End time  Duration   Badness        from                    to
                     (seconds)

1761455840 1761455911     71	  0.001	# 26 October 2025 16:17:20 26 October 2025 16:18:31
1765840172 1765840185     13	  0.001	# 16 December 2025 10:09:32 16 December 2025 10:09:45
1767591722 1767594561   2839	  0.002	#  5 January 2026 16:42:02  5 January 2026 17:29:21
1770087310 1770088488   1178	  0.001	#  3 February 2026 13:55:10  3 February 2026 14:14:48
1770089278 1770089324     46	  4.557	#  3 February 2026 14:27:58  3 February 2026 14:28:44
1772180265 1772180310     45	  0.002	# 27 February 2026 19:17:45 27 February 2026 19:18:30
1773201986 1773202043     57	  0.004	# 11 March 2026 15:06:26 11 March 2026 15:07:23
1773335006 1773335156    150	  0.027	# 13 March 2026 04:03:26 13 March 2026 04:05:56
1773335994 1773336099    105	  4.296	# 13 March 2026 04:19:54 13 March 2026 04:21:39
1773996590 1773996660     70	  0.005	# 20 March 2026 19:49:50 20 March 2026 19:51:00
1774007442 1774053241  45799	  0.334	# 20 March 2026 22:50:42 21 March 2026 11:34:01
1775049905 1775051626   1721	  0.004	#  2 April 2026 00:25:05  2 April 2026 00:53:46
1776549450 1776554381   4931	  0.002	# 19 April 2026 07:57:30 19 April 2026 09:19:41
1779417862 1779419052   1190	  0.001	# 22 May 2026 12:44:22 22 May 2026 13:04:12
1780700310 1780701667   1357	  0.003	#  6 June 2026 08:58:30  6 June 2026 09:21:07
1784537893 1784538353    460	  0.001	# 20 July 2026 18:58:13 20 July 2026 19:05:53

Summary
Total 615 outages, total time 1401051 seconds (16 days, 05:10:51)
Longest outage:			192150 seconds (2 days, 05:22:30)
   Start:			21 February 2015 04:36:54
   End:				23 February 2015 09:59:24
Average time between outages:	638504 seconds (7 days, 09:21:44)
Average duration:		2278 seconds (00:37:58)
Availability:			99.64%
“Badness” is an attempt to quantify the effect. It's the reciprocal of the number of seconds per hour that the link was up between failures (i.e. 3600 / uptime).
And here is the summary information for the past 10 days with a less than 100% record:
Timestamp      Outages  Duration  Availability    Date
                        (seconds)
1770037200	  2	  1224	 98.58%	#  3 February 2026
1772110800	  1	    45	 99.95%	# 27 February 2026
1773147600	  1	    57	 99.93%	# 11 March 2026
1773320400	  2	   255	 99.70%	# 13 March 2026
1773925200	  2	  4228	 95.11%	# 20 March 2026
1775048400	  1	  1721	 98.01%	#  2 April 2026
1776520800	  1	  4931	 94.29%	# 19 April 2026
1779372000	  1	  1190	 98.62%	# 22 May 2026
1780668000	  1	  1357	 98.43%	#  6 June 2026
1784469600	  1	   460	 99.47%	# 20 July 2026
The dates in the left columns are in UNIX time_t format to ease further processing. I also have lists of all individual outages, or summaries per day.
| Greg's home page | Greg's diary | Greg's photos | Copyright |