
| Greg's network link statistics |
|
||||||
|
|
|
|
|||||||||||
One of the less pleasant consequences of moving from Echunga to Dereel in July 2007 was that I lost my ADSL line and had to resort to other methods. After a disastrous attempt to use Telstra's NextG service, I got a satellite connection with IPStar. This was the most unreliable network connection I have ever had. In December 2010, I moved to Internode's NodeMobile Data service.
This page bases on earlier pages that I wrote for the DSL and satellite connections.
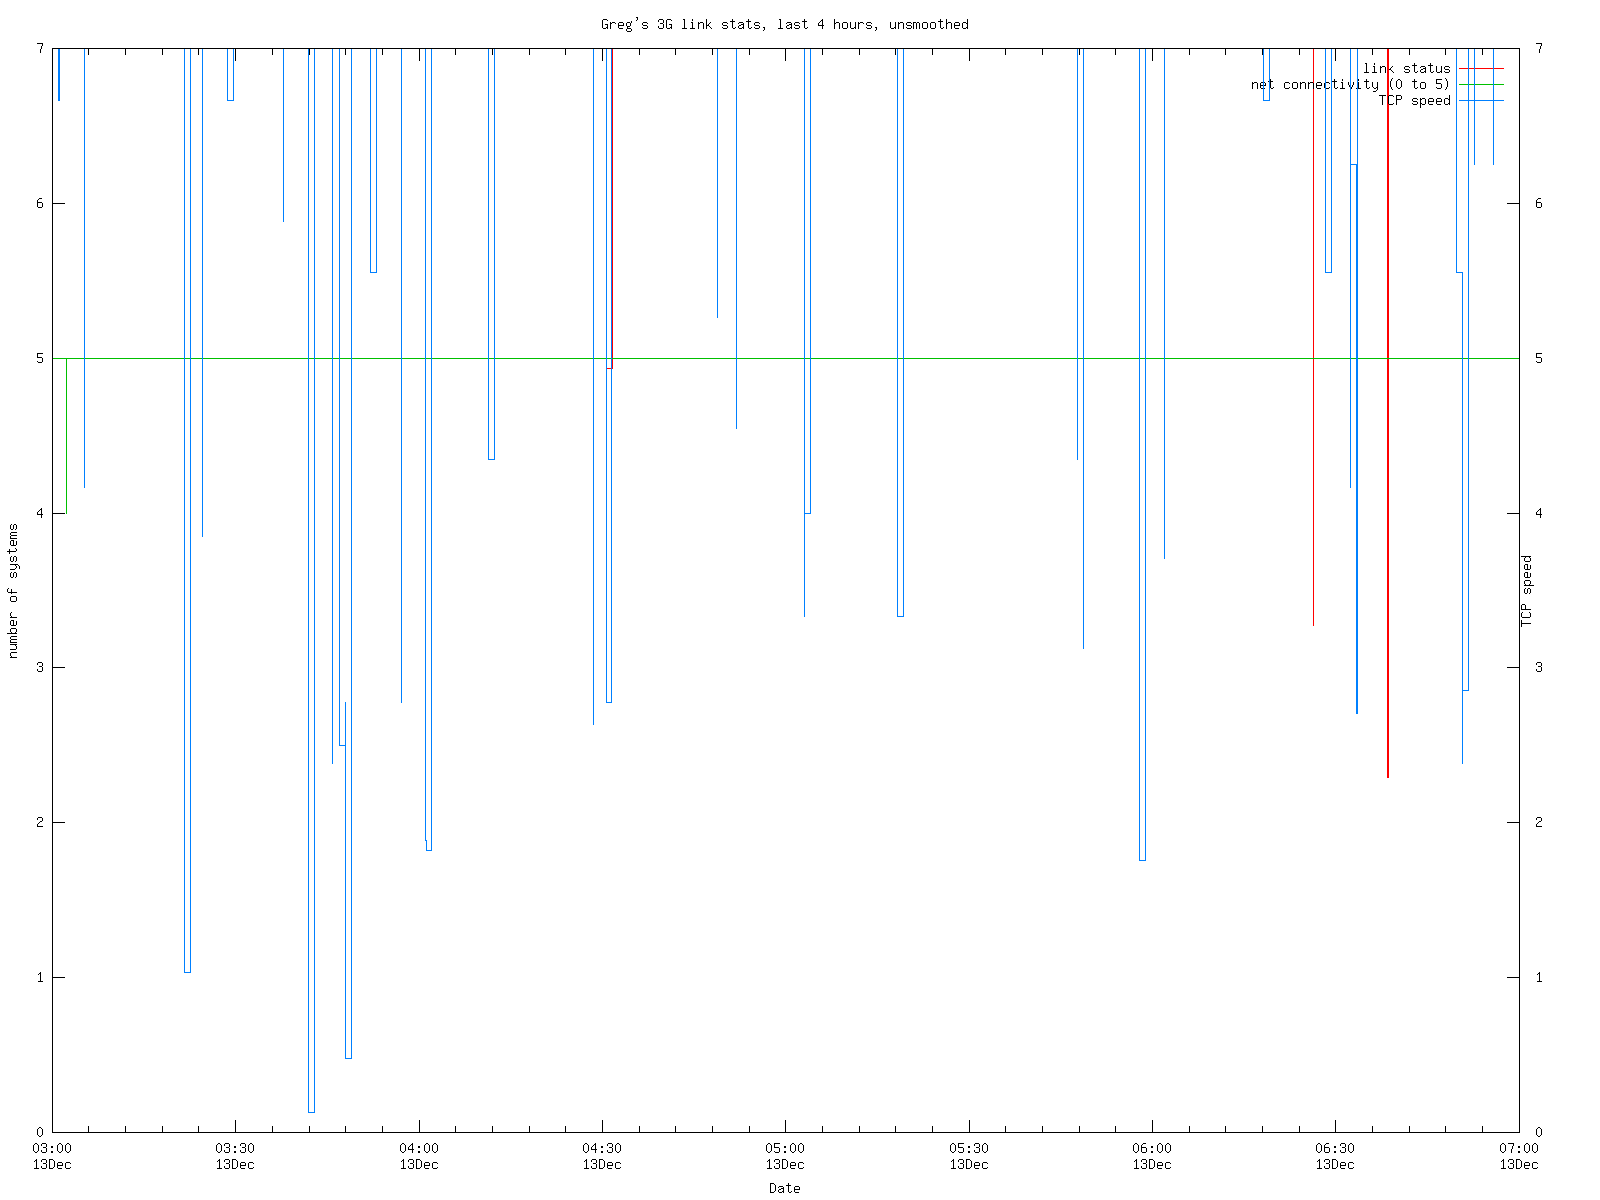
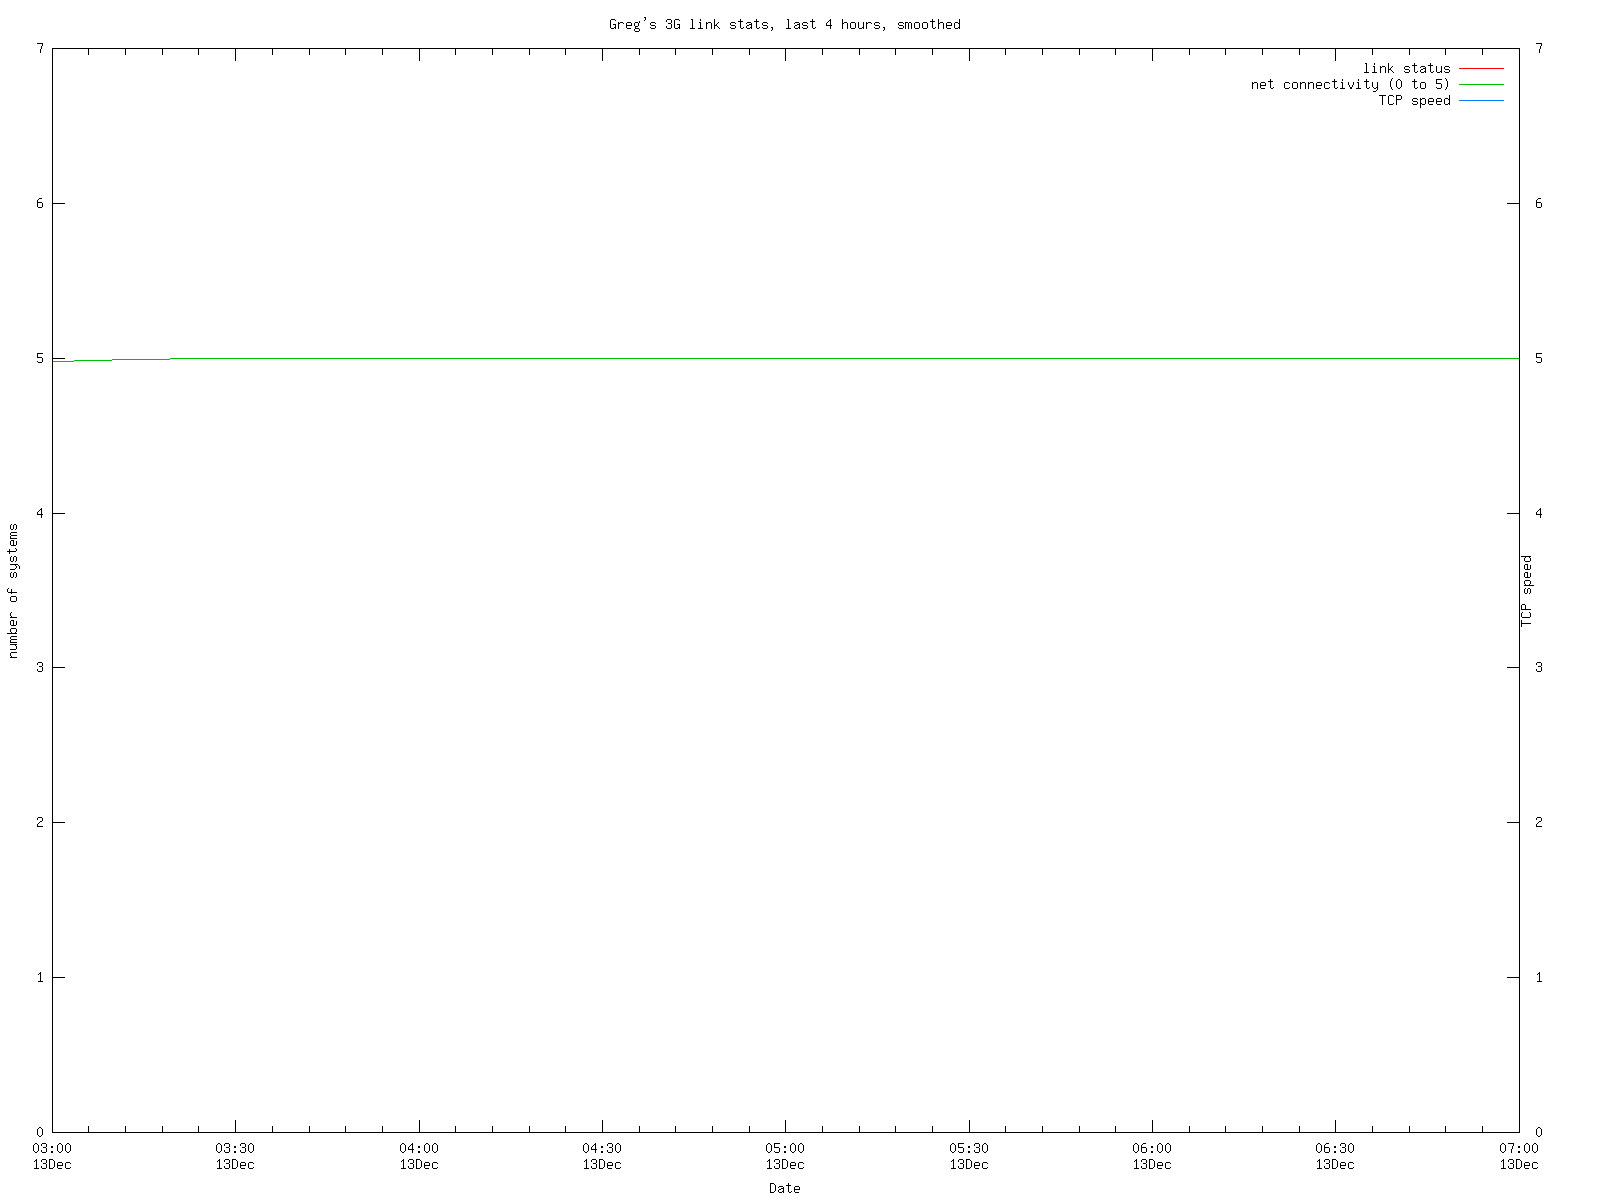
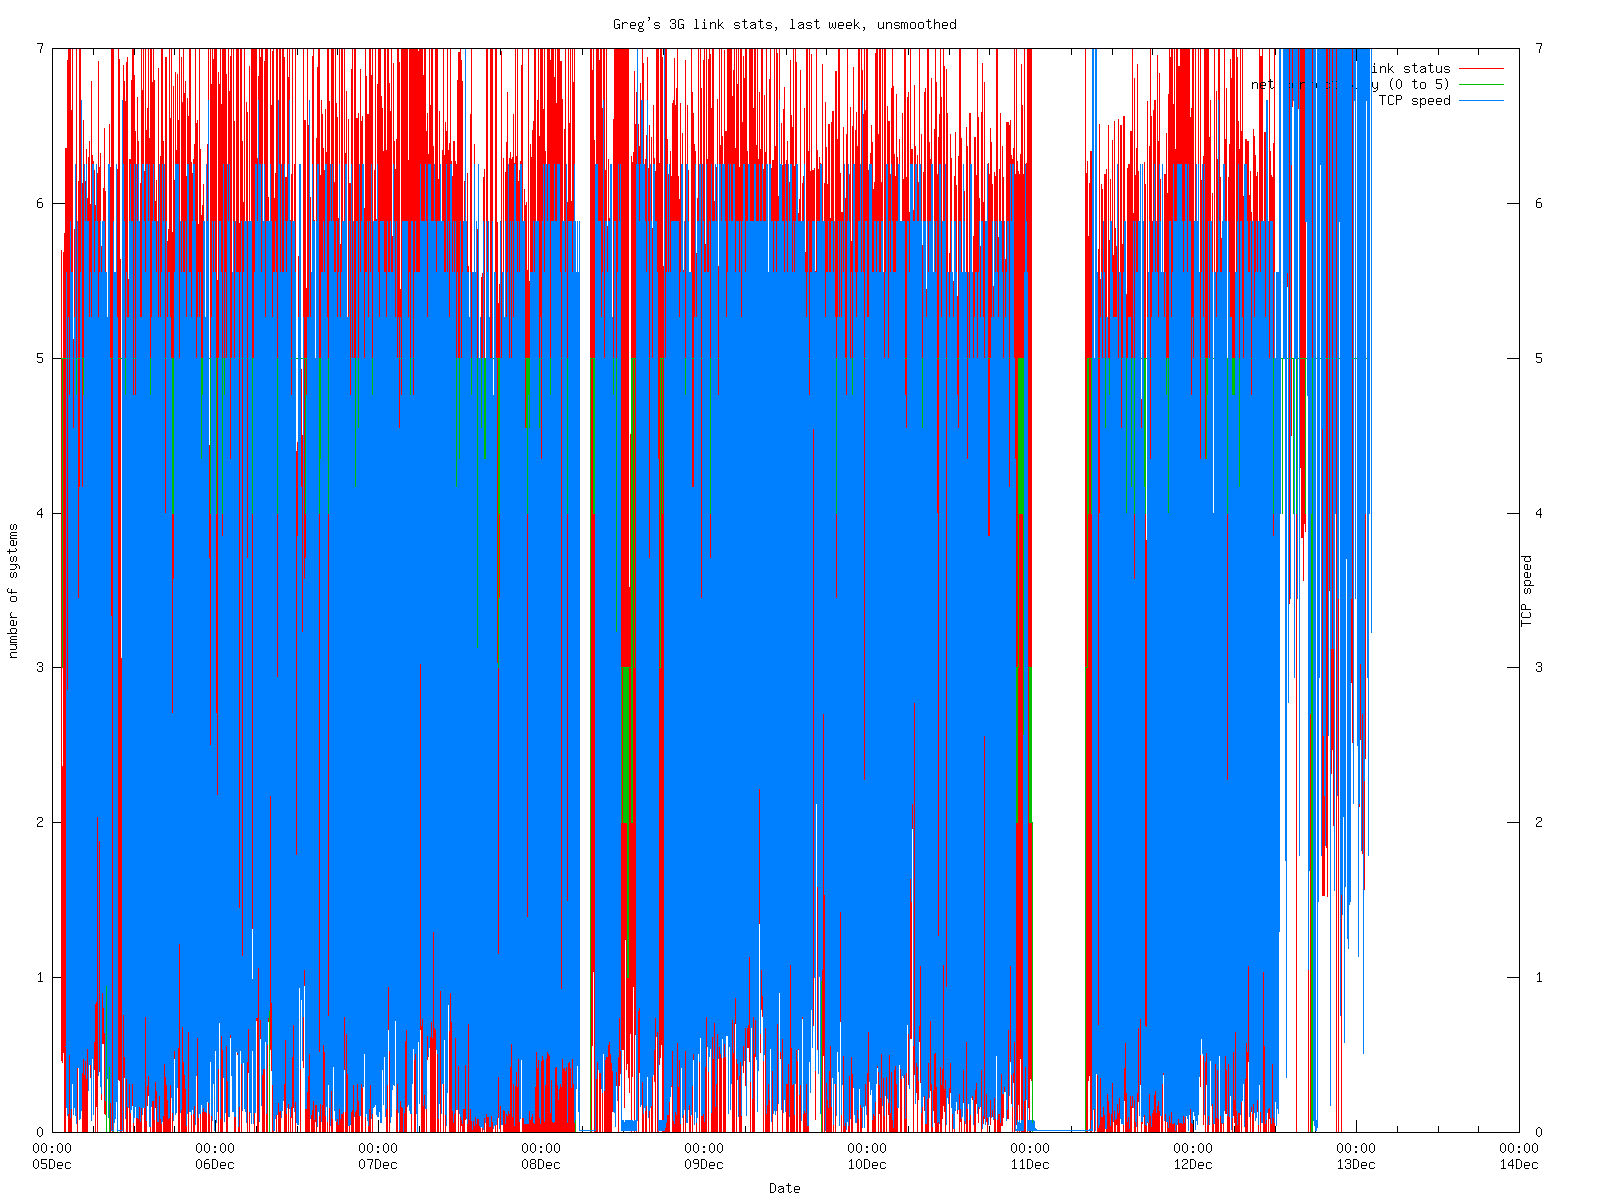
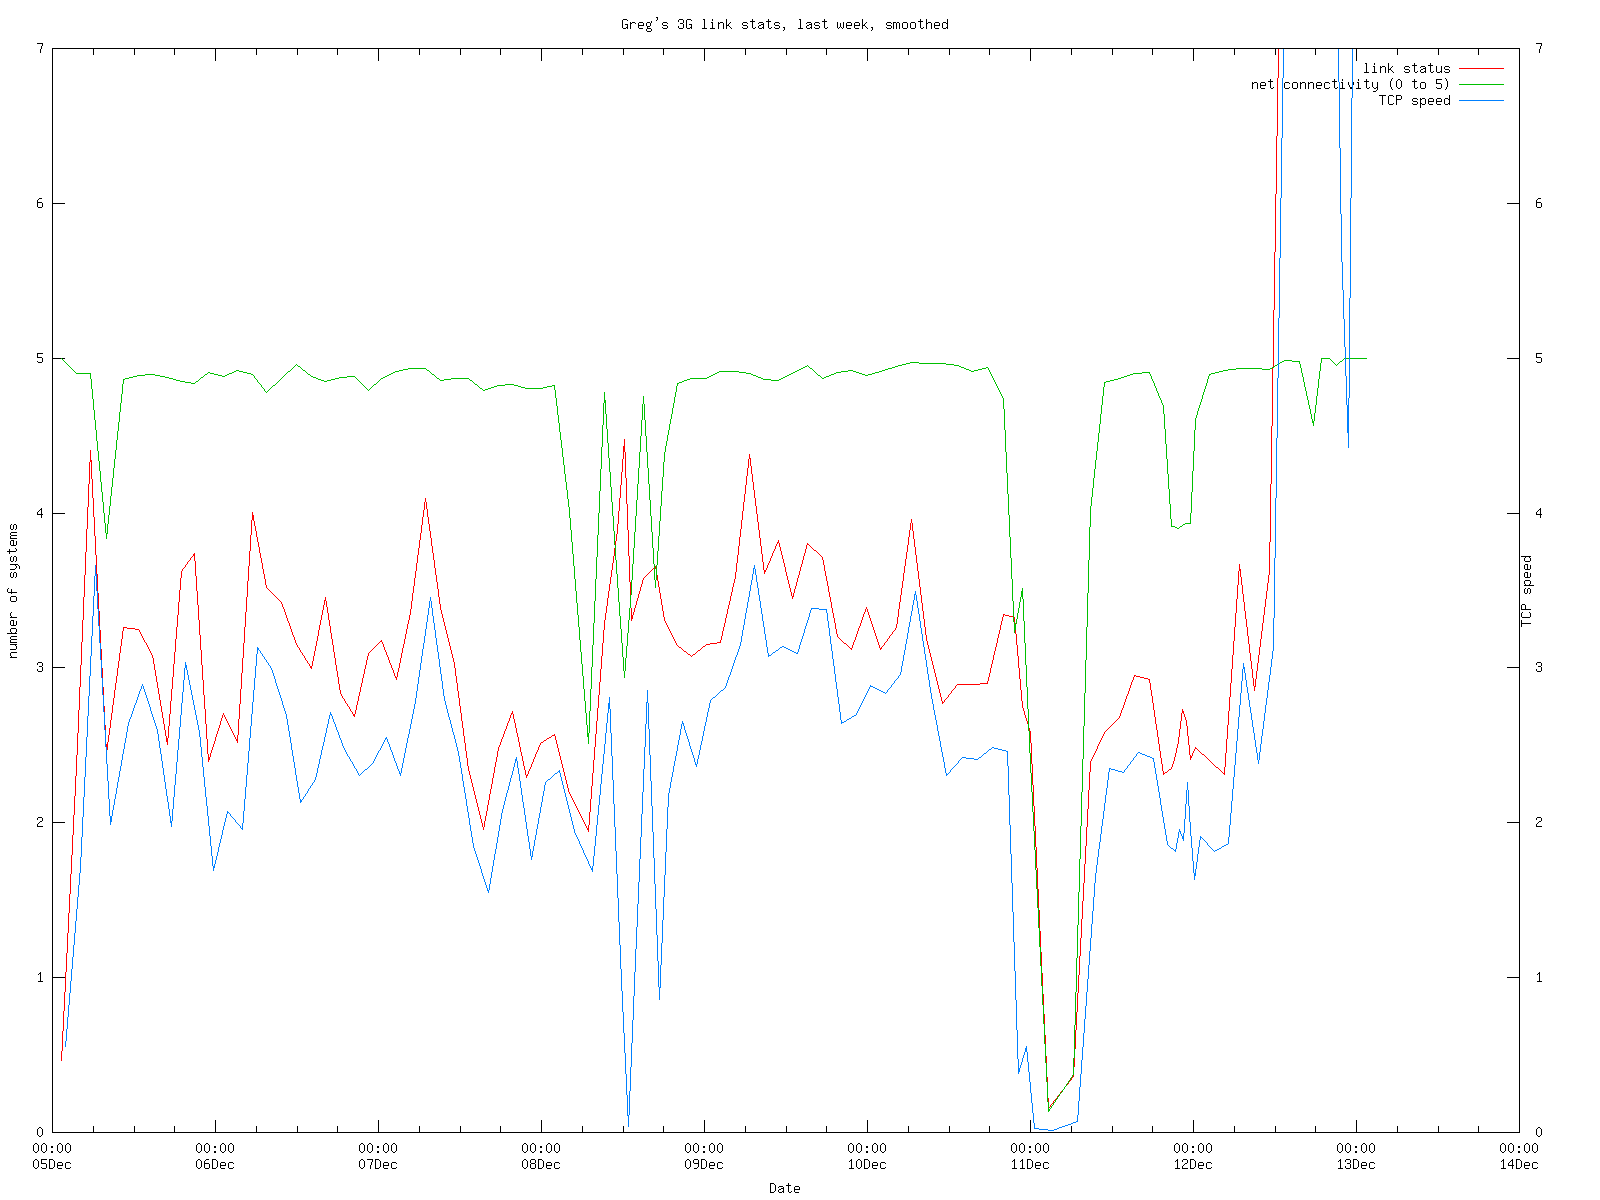
The graphs show:
Link status. This is the connectivity to the other end of the 3G link, measured by an ICMP echo (ping) packet once a minute. The value is a reciprocal function of the ping time, 0.5 / ping_time. Thus 5 represents a ping time of 100 ms, and 1 represents 500 ms. 0 indicates a link failure.
Network status. This is the number of remote systems responding to a ICMP echo (ping) packet at the same time as the link status ping. I currently ping 5 systems which I frequently access: freefall.FreeBSD.org, w3.lemis.com, www.auug.org.au, ozlabs.org and ftp.NetBSD.org. Normally this value should be 5. If it's less, the script retries every second until full connectivity is restored.
“TCP speed”, a reciprocal function of the time it takes to transfer a very small “web page” (four bytes) from my external web server. The values shown are reciprocal seconds: 0.5 is 2 seconds, 2 is 0.5 seconds, etc. This graph doesn't directly show the loss of TCP connectivity: as long as the “speed” is above 0, I have connectivity. When the connectivity goes away, the “speed” drops to 0.
This speed was of particular interest with the satellite link. I'm not sure it makes much sense over 3G, but we'll see.
The graphs were made with gnuplot, and I'm not very happy with the smoothing. In particular, the right-hand side of smoothed graphs has too much influence, and it's easy to get the false impression that the link status or TCP speed have changed significantly in the last few minutes. If anybody can point me at a way to fix this problem, I'd be grateful.
Click on the graphs for a 1600x1200 version.
With the satellite link I had continual outages, 1685 over a period of 3 years, or one every 15 hours. This section will monitor the 3G link for similar outages, though I hope they'll be much better. I have a program that evaluates the outage information and produces detailed outage information. Here's the information on the past 10 outages, along with the overall statistics:
Start time End time  Duration   Badness        from                    to
                     (seconds)

0 0 hub w3 www.auug.org.au ozlabs.org ftp.netbsd.org 	#

Start time End time	Duration	Badness
0 0 hub w3 www.auug.org.au ozlabs.org ftp.netbsd.org 	#


Total 1 outages, total time 0 seconds (00:00:00)
Average time between outages:	0 seconds (00:00:00)
Average duration:		0 seconds (00:00:00)
Availability:			  nan%
“Badness” is an attempt to quantify the effect. It's the reciprocal of the number of seconds per hour that the link was up between failures (i.e. 3600 / uptime).
And here is the summary information for the past 10 days with a less than 100% record:
Date        Outages   Duration  Availability    Date
                      (seconds)
0 0 hub w3 www.auug.org.au ozlabs.org ftp.netbsd.org 	#

Date        Outages   Duration  Availability
0 0 hub w3 www.auug.org.au ozlabs.org ftp.netbsd.org 	#

-36000	  1	 50400	 41.67%	#  1 January 1970
Total:		  1	 50400	100.00%
The dates in the left columns are in UNIX time_t format to ease further processing. I also have lists of all individual outages, or summaries per day.
The scripts that do this monitoring are:
I'm still adapting the scripts from the satellite versions. If you're interested, come back in a few days, or send me mail.
| Greg's home page | Greg's diary | Greg's photos | Copyright |